
Let’s take the fun out of baseball for a second. Well, I suppose for some of us the topics of launch angle and Exit Velo and these new-fangled hitting terms fun. Baseball today is not as simple as picking up a bat and swinging hard. The science of hitting has leveled up in recent years, with players focused on elevating the ball being rewarding with a multitude of home runs and big pay days. As detailed in Swing Kings, independent hitting coaches have leveraged the use of video and intensive study of home run giants such as Barry Bonds to create the perfect swing. Which, by today’s metrics, means the perfect home run swing. Let’s take a look at some real MLB data to see what this looks like in practice.
Launch angle
Ahhh, yes! You’ve heard of it - the almighty launch angle! Actually, students of hitting have at the very least been introduced to launch angle if they’ve perused Ted Williams’ “The Science of Hitting” where he states
If you get the ball into the air with power, you have the gift to produce the most important hit in baseball — the home run. More important is that you hit consistently with authority. For those purposes I advocate a slight upswing (from level to about 10 degrees)
Williams is not exactly sure what the angle is, but he approximates 10 degrees with the knowledge that anything less and you’ll be unlikely to get an extra-base hit. Anything too much more than 10 degrees is most likely an out. The chart below shows batted results (i.e. balls put in play plus home runs and leaving out sacrifice bunts) with a launch angle of less than or equal to 10 degrees using Statcast data from 2019.
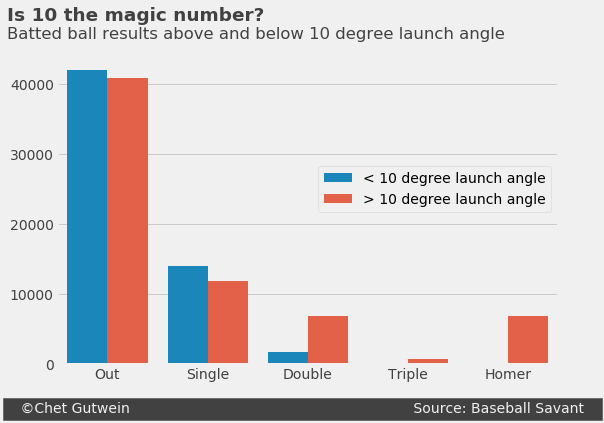
To interpret Williams’ wisdom, it’s pretty clear where he’s coming from. Maybe his reference to 10 degrees is approximate, but the number of outs generated in all of MLB in 2019 on batted balls at an angle less than 10 degrees is almost identical to that over 10 degrees. The biggest takeaway here, though, is that a hitter will score at best a double, when swinging down on the ball. This simple message from “The Science of Hitting” is at the heart of the power surge MLB saw in 2019.
Nuance of the upward swing
The margin for error between a groundball, a home run, and a pop-up is incredibly small. The traditional swing philosophy of hitting down on the ball is not completely incorrect, in that, swinging for the fences often times leads hitters to bad habits by overcompensating with an exaggerated upward swing and results in far more outs than extra-base hits. The chart below shows the relationship between launch angle and exit velocity. There is a small area indicated in red that shows where home runs were hit. The range of launch angle for home runs is roughly 20 degrees to 40 degrees and nearly all home runs were struck with an exit velocity north of 90 miles per hour (mph).
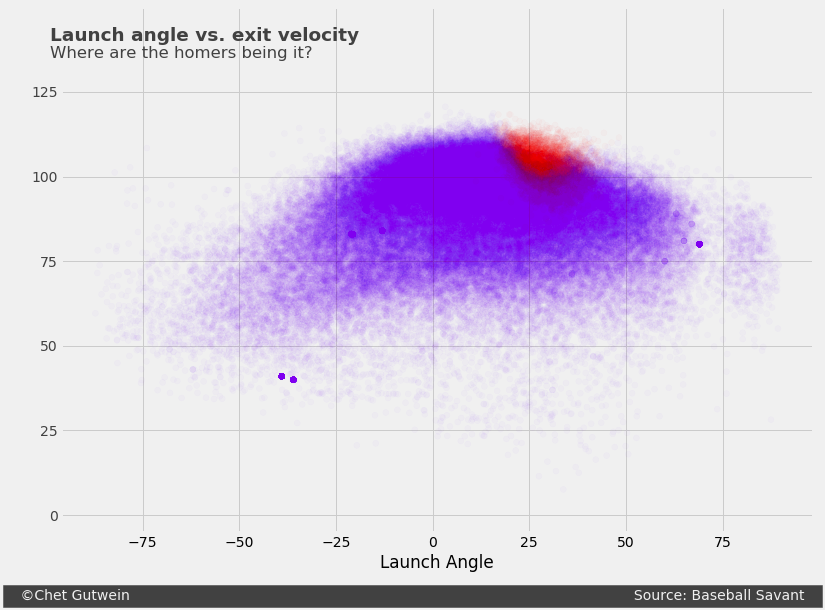
This is motivating up-and-coming hitters to tune their swings for this target area. It’s not just the home runs, but extra-base hits in their entirety. As we hinted earlier, go to the extreme with the launch angle and a hitter is bound to lift the ball too high.
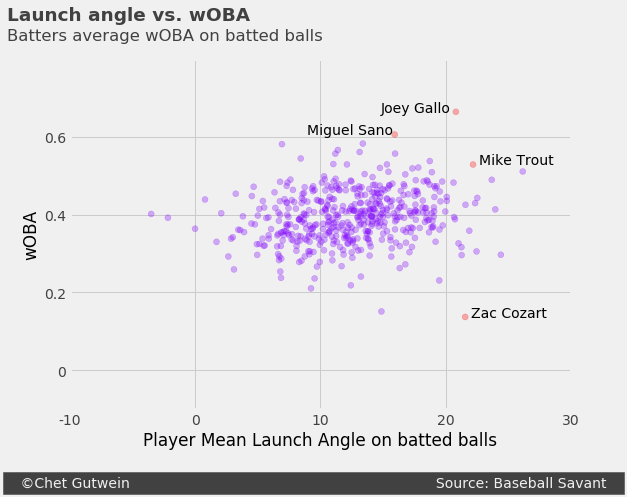
We plotted launch angle against weight on base percentage (wOBA) of batted balls for all MLB player in 2019 with at least 50 batted balls. In this set of data, there are exactly 20 batters with a mean launch angle over 20 degrees, including Three True Outcomes (TTO) poster boy Joey Gallo, and consensus best player in baseball Mike Trout. Trout’s teammate Zach Cozart is also included in this group, however, Cozart’s wOBA is significantly lower than his peers. It’s worth noting that while Trout played a whole season, Gallo and Cozart had injury-shortened 2019 seasons in which they had 297 and 107 plate appearances (PA), respectively. In Cozart’s case, this small sample probably produced a higher mean launch angle than he would in a full season.
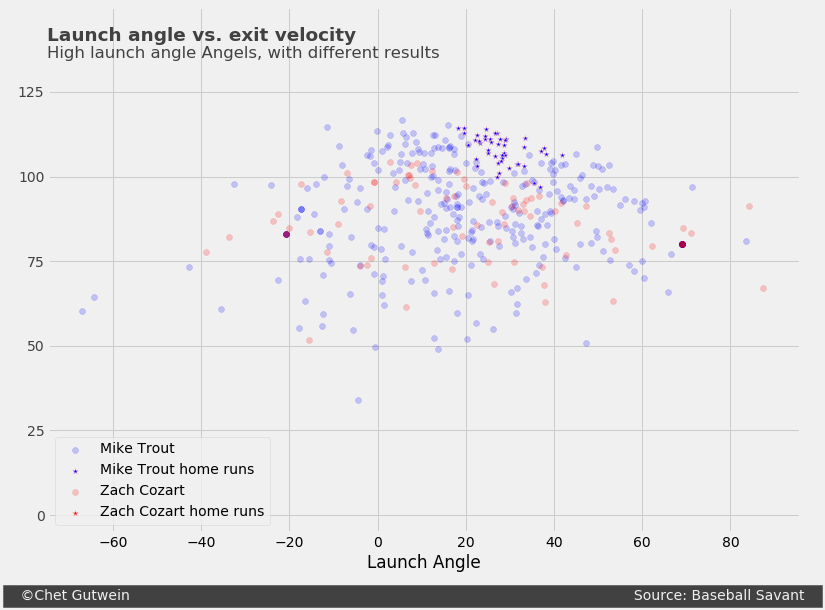
The comparison between Trout and Cozart is interesting because while they both get the ball in the air extremely well, the fruits of their labor vary greatly, with Trout achieving among the highest wOBA on batted balls and Cozart near the bottom. Looking at their distribution of batted balls on the same plot, the most clear difference between the two is home run production and the exit velocity ceiling. Trout has a cluster of batted balls with an exit velocity above the 100 mile per hour threshold, whereas Cozart has a mere half-dozen. The power generated by Trout often results in home runs - he hit 45 of them in 2019. Cozart had none.
Launch angle and exit velocity go hand-in-hand, and next week we’ll be posting a short follow up to today’s dive into launch angle, examining the history of these measurements and where they fit within the context of MLB’s steroid era and the juiced ball of 2019.
The charts in this post were created in python using Statcast data. Supporting documentation can be found here.