
While a lot of things in baseball have changed in recent years, some have stayed exactly the same. Baseball scouts have used the 20-80 scale to evaluate players tools for decades. The idea behind the scale is that a score of 50 indicates league average. These grades apply to both tools and an overall scouting grade for each player. Furthermore, player evaluators will typically assign a player a current value and a future value, hence the name of the recent book on the subject by Eric Longenhagen and Kiley McDaniel.
The question we pose cuts a little deeper however. In this post, we’ll describe in detail the 20-80 scale and how we can use Statcast data to define the scale for several tools. In addition, we’ll investigate how much scouting can be done from behind a computer vs. actually being present at games to see players in live action.
Hitter Tools
The main tools that are evaluated for position player prospects (i.e. hitters) are contact (or hit), power, speed, arm strength, and fielding. Power is especially significant in today’s game, as the home run has been identified as the single most impactful result a hitter can have. Thus, power is typically evaluated a two seperate tools: raw power and game power. We’ve previously discussed the relationship of launch angle and exit velocity with hitting home runs. The measure for raw power is the maximum exit velocity that a hitter can generate. As you might imagine, using Statcast as a basis for scouting grades makes a player’s value a bit fluid as there will be fluctuations from season to season. That said, having a complete dataset of raw data measurements allows us to objectively categorize using the scale. So let’s look at the player tier for maximum exit velocity in 2019 using Statcast data.
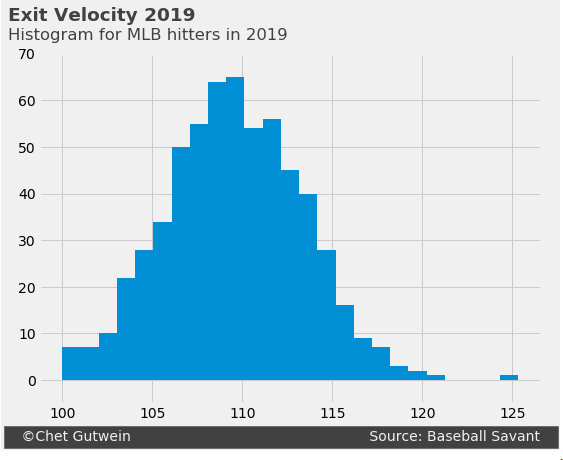 Above we have the plotted histogram of maximum exit velocity from a hitter in 2019. Please note that we have filtered results to include only maximum launch speeds greater than or equal to 100 mph because there are so few results lower than 100. Also, results for pitchers are filtered out as well. Calculating the 20-80 scale is really quite easy. We’ll use the mean, \(\mu\) and the standard deviation, \(\sigma\) to determine the range for each grade in raw power based on a player’s maximum exit velocity.
The average maximum exit velocity generated by a player is 109 mph with a standard deviation of 3 mph. Applying the principles of the 20-80 scale, this makes a player with a maximum of 112 mph a 60 and a player with a 106 mph a 40. We’ll make use of interpolation to map a hitter’s maximum exit velocity to their raw power grade on the 20-80 scale. We’ll make use of the interpolate capabilities of the scipy package in Python to create a function to map a player’s maximum launch speed to a scouting grade.
Above we have the plotted histogram of maximum exit velocity from a hitter in 2019. Please note that we have filtered results to include only maximum launch speeds greater than or equal to 100 mph because there are so few results lower than 100. Also, results for pitchers are filtered out as well. Calculating the 20-80 scale is really quite easy. We’ll use the mean, \(\mu\) and the standard deviation, \(\sigma\) to determine the range for each grade in raw power based on a player’s maximum exit velocity.
The average maximum exit velocity generated by a player is 109 mph with a standard deviation of 3 mph. Applying the principles of the 20-80 scale, this makes a player with a maximum of 112 mph a 60 and a player with a 106 mph a 40. We’ll make use of interpolation to map a hitter’s maximum exit velocity to their raw power grade on the 20-80 scale. We’ll make use of the interpolate capabilities of the scipy package in Python to create a function to map a player’s maximum launch speed to a scouting grade.
from scipy.interpolate import interp1d
scaled = interp1d([mu-3*sigma, mu+3*sigma], [20,80], bounds_error=False, fill_value=20)
Max EV Tables
The table below shows five records from the 2019 dataset where launch_speed is the hitter’s maximum recorded exit velocity and EV_grade is the corresponding scouting grade:
| Batter | Position | launch_speed | EV_grade |
|---|---|---|---|
| Albert Pujols | 1B | 112.3 | 61.000000 |
| Miguel Cabrera | 1B | 111.4 | 58.000000 |
| Jeff Mathis | C | 105.5 | 38.333333 |
| Shin-Soo Choo | OF | 111.8 | 59.333333 |
| Rene Rivera | C | 105.2 | 37.333333 |
Here are the ranges with some random player examples for each category:
| Scouting Grade | Cutpoint Value | Example Players |
|---|---|---|
| 80 | 117.4 | Jose Abreu(117.9), Daniel Palka(118.0) |
| 75 | 115.8 | Bryce Harper(116.4), Miguel Sano(115.8) |
| 70 | 114.3 | Eric Hosmer(114.3), Trea Turner(114.4) |
| 65 | 112.8 | Chris Iannetta(113.2), Derek Fisher(113.8) |
| 60 | 111.3 | Kris Bryant(111.4), Tyler O'Neill(111.8) |
| 55 | 109.8 | Victor Robles(110.9), Andrew McCutchen(110.3) |
| 50 | 108.3 | Keon Broxton(109.4), Francisco Mejia(109.6) |
| 45 | 106.8 | J.T. Riddle(107.0), Eduardo Escobar(107.4) |
| 40 | 105.3 | Ian Kinsler(106.0), Rafael Ortega(105.6) |
| 35 | 103.8 | Reese McGuire(104.5) |
| 30 | 102.3 | Hanser Alberto(103.6), Mark Zagunis(103.1) |
| 25 | 100.8 | Caleb Joseph(100.8), David Freitas(102.0) |
Applications for 20-80 not limited
From sprint speed to strikeout rate, there are many ways to apply this methodology in baseball. For our example case, we used one of the most commonly talked about hitter skills, but this only scratches the surface of what analysts and scouting departments evaluate. Keep in mind also, that using Statcast data sets the bar for the MLB. When scouting prospects, however, there is a much more complex process where scouts need to go outside the current value for a player and project his future value. Outside of the MLB, there is a lot of variability surrounding the measurement capabilities available to players, depending on where they play (high school, Division 1, etc.) and resources available.